Chips and Speed: Serving addicts w/ AI psychosis
What is the most tok/s one chip can push?
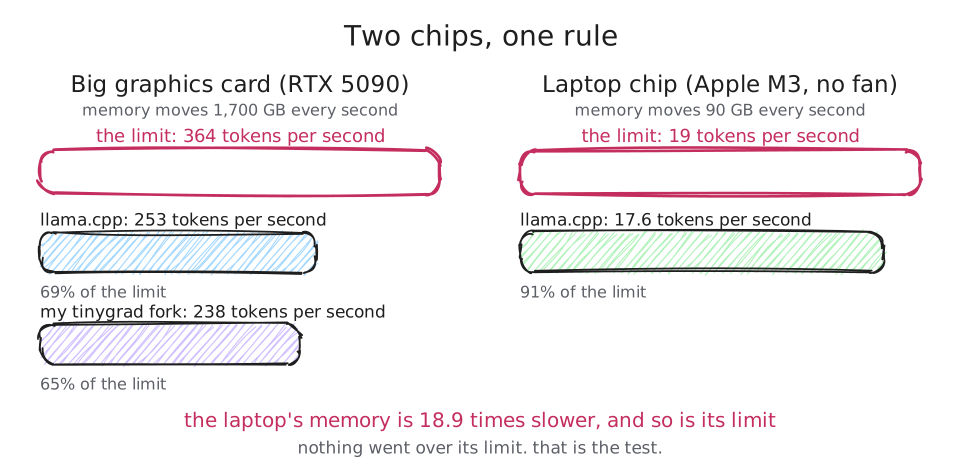
M3 GPU (unified memory): 12 to 19 tokens per second, under its limit of 20.7RTX 5090 (VRAM): tinygrad 156 to 260, under its limit of 364
M3 GPU (unified memory): llama.cpp 17.56, 91% of its limitRTX 5090 (VRAM): llama.cpp 247.8, 68%; tinygrad 237.8, 65%Nothing went over its limit
Technical words are explained in plain language at the bottom, under Words used here. Every formula, with a worked example you can check on a phone, is just above it, under Formulas used here.
The question
Tokens. Some enthusiasts say tokes. The addicts cannot get enough of them. They want them faster, they want them cheaper. The press calls it AI psychosis.
So I asked the drug dealer's question. What is the most product one chip can push?
The GPU chip has two things: a place that does sums and a place that holds the model. To make one token, the sums are small. The reading is not. The chip has to read almost the entire model out of memory, every single token, for every single customer. That is the supply, and it comes with a speed limit (Williams, Waterman and Patterson, 2009):
I had worked that out on one chip, an NVIDIA RTX 5090 (32 GB VRAM), in my article BoltBeam: Opening the Black Box of Kernel Engineering. One chip is an anecdote. So this follows the division end to end, from the chip to tokens per second, on two very different chips, with two programs that share no code.
The Math
Start from the chip. Not from a benchmark, not from a vendor's slide. From the spec sheet, and then from what the chip really delivers when you measure it. Two chips, two makers.
| The chips' own facts, no program | NVIDIA RTX 5090, 32 GB VRAM | Apple M3 GPU, 16 GB unified memory |
|---|---|---|
| Where it lives | a desktop, with fans | a MacBook Air, no fan |
| Compute units | 170 streaming multiprocessors, 21,760 lanes (BoltBeam target registry) | 10 GPU cores (Apple, MacBook Air M3 specifications) |
| Threads that move in lockstep | 32, a warp | 32, a simdgroup |
| Matrix unit | tensor cores, mma.sync.m16n8k16 | simdgroup_matrix, 8 by 8 by 8 |
| Memory speed, published | 1,792 GB per second | 100 GB per second (Apple, MacBook Air M3 specifications) |
| Memory speed, measured | 1,700 GB per second, 95% (fork records, new target bring-up) | 89.9 GB per second, 90% (this entry) |
| Sums per second, published | 419 trillion, fp16 dense on the sheet | Apple publishes none. 3.5 trillion, fp32, is what third parties compute from the clock and the core count, 10 cores at 1.38 GHz (Flopper, Apple M3) |
| Sums per second, measured | 255.4 trillion on the matrix unit, 61% of the sheet (fork records, new target bring-up) | 3.15 trillion on the matrix unit, 90% of the third-party figure (this entry) |
| Memory for the model | 32 GB of VRAM, its own, GDDR7 | 16 GB of unified memory, shared with the CPU |
Two of those rows do all the work in this entry: memory speed and sums per second. Every number that follows is derived from them, and I use the measured column, never the published one. Both chips deliver less than the box says, 95% and 90%. Measure the ceiling. Never quote it.
The sums per second of the M3 GPU (unified memory) come from my fork's own matrix-unit benchmark, the one that measured an Apple M4 at 3.78 trillion: a loop of simdgroup_multiply_accumulate with no memory reads in it, swept over grid size and accumulators until it stops rising (fork source, wmma_peak_metal.py, fork records, what makes inference fast). The M3 plateaus at 3.15 trillion. Plain arithmetic on the same chip reaches 3.24 trillion adding in fp16, 2.89 in fp16 into fp32, and 2.82 in fp32 (fork source, fma_peak_metal.py). That is the same shape the M4 showed: Apple's matrix operation runs on the same arithmetic units as ordinary sums. There is no second, faster pipe to route work onto.
The model. Qwen3 8B, stored as GGUF, 5,021,827,072 bytes. BoltBeam reads the file, not the name, and lists the parts: 36 layers, each with a gate and up table of 12,288 by 4,096, an attention block of 4,096 by 4,096 plus key and value tables of 1,024 by 4,096, and a down table of 4,096 by 12,288, then one vocabulary table of 151,936 by 4,096. The gate, up and attention tables are 4-bit, stored in Q4_K, which is 4.5 bits per weight once you count its scales. Half the down tables and the vocabulary table are Q6_K, 6.5625 bits per weight (llama.cpp source, ggml-common.h, BoltBeam quant registry). Add every part up and one token reads 4.68 GB.
The division. A chip is held back by one of two things: how fast it does sums, or how fast memory feeds it (Williams, Waterman and Patterson, 2009). Which one depends on the work. Writing one token, each weight is read once and used for two sums. At 4.5 bits a weight that is about 3.6 sums per byte. The RTX 5090 (VRAM) can do about 150 sums for every byte its memory delivers, and the M3 GPU (unified memory) about 35. Both are far above 3.6. So writing a token is a memory problem on both chips.
My method notes turn that test into one number. The method started on the AMD GPU, a Radeon RX 7900 XTX (24 GB VRAM), the first GPU where both halves were measured, and every GPU since gets the same treatment (fork records, what makes inference fast). Take tokens processed together, a model of weights stored at bits each, sums per second and memory speed . Set the time for the sums equal to the time for the bytes, and the model size cancels:
Below tokens at a time, memory is the wall. Above it, the sums are. With :
| The crossover, no program | NVIDIA RTX 5090 | Apple M3 |
|---|---|---|
| , sums per second, measured | 255.4 trillion | 3.15 trillion |
| , memory speed, measured | 1,700 GB per second | 89.9 GB per second |
| 42 tokens | 10 tokens |
Writing one token is , far below both. Reading a 512-token prompt is , far above both. Decode and prefill are not two settings of one problem. They are two different problems. My notes could only give the Apple M4 this number as a function of an unmeasured memory speed, (fork records, what makes inference fast); here both halves are measured.
So the speed limit is:
where is the memory speed, measured, and is the bytes one token reads.
| The division, no program | NVIDIA RTX 5090 | Apple M3 |
|---|---|---|
| Memory speed, measured | 1,700 GB per second | 89.9 GB per second |
| Bytes one token reads | 4.68 GB | 4.68 GB |
| Speed limit | 364 tokens per second | 19.2 tokens per second |
| Floor for one token | 2.75 milliseconds | 52 milliseconds |
| Floor for the vocabulary step alone | 300 microseconds | 5,680 microseconds |
The memory speeds are 18.9 times apart, so the limits are 18.9 times apart. No program on earth gets more out of these two chips with this model. The vocabulary floor, 510 MB over 1,700 GB per second, comes out at 300 microseconds; my ledger's exact figure is 300.06 (fork records, decode ledger). The division on a phone reproduces the ledger.
Said before the run
The M3 GPU (unified memory): under 20.7 tokens per second, which was the limit at Apple's published 100 and the measured 4.83 GB per token on the RTX 5090 (VRAM); I expected 12 to 19. tinygrad on the RTX 5090 (VRAM), with 512 tokens of conversation loaded: between 156 and 260, and under 364. Over the limit and the division is wrong.
Later, before the second run on the M3 GPU (unified memory) with 512 tokens loaded: each new token then also reads the conversation's memory, 75.5 MB more, so the limit drops from 19.2 to 18.9. On the RTX 5090 (VRAM) llama.cpp lost 1.9% going from none to 512 tokens. So the M3 GPU (unified memory) lands 1% to 4% below its first run, about 16.9 to 17.4, and under 18.9.
What happened
Both predictions held. Here is every run, against its limit.
| GPU, its limit | Program | Conversation loaded | Tokens per second | Of the limit | Time per token | Above the floor |
|---|---|---|---|---|---|---|
| Apple M3, 19.2 | llama.cpp | none | 17.56 | 91% | 57.0 ms | 5.0 ms |
| Apple M3, 19.2 | llama.cpp | 512 tokens | 17.00 | 88% | 58.8 ms | 6.8 ms |
| NVIDIA RTX 5090, 364 | llama.cpp | none | 252.6 | 69% | 3.96 ms | 1.21 ms |
| NVIDIA RTX 5090, 364 | llama.cpp | 512 tokens | 247.8 | 68% | 4.04 ms | 1.29 ms |
| NVIDIA RTX 5090, 364 | tinygrad, my version | 512 tokens | 237.8 | 65% | 4.20 ms | 1.45 ms |
Nothing went over its limit. Two programs, two chips, five runs. One number above the line would have ended this entry.
Where llama.cpp stands. On the M3 GPU (unified memory) it is 5 milliseconds above a 52 millisecond floor. That is close to done: the memory is busy 91% of the time and the rest is the cost of doing business. On the RTX 5090 (VRAM) it is 1.2 to 1.3 milliseconds above a 2.75 millisecond floor. That is the improvement that is still on the table: about a third of every token on the flagship is not spent reading weights. The last column is the whole to-do list.
The second program. tinygrad, my own version, shares no code with llama.cpp and drives the RTX 5090 through its own driver code. Same model, same RTX 5090, same 512 tokens loaded, 20 tokens timed, once: 4.20 milliseconds per token, 237.8 tokens per second, 65% of the limit. Two programs that share nothing, both at two thirds of the same wall. The wall belongs to the chip.
llama.cpp was 4.2% ahead here. My careful ledger has my version ahead at this setting (fork records, decode ledger); it repeats the timing in many windows, in alternating order, and keeps a result only when the windows agree. This single run of 20 tokens does none of that, on a checkout with unfinished work in it. So who is ahead stays with the ledger. What this run settles is that the limit holds for a second program.
The M3 GPU (unified memory) is closer to its limit than the RTX 5090 (VRAM). 88% against 68% with the same page of conversation loaded. The next section measures why, part by part, on both chips.
So where are the improvements? To answer that you have to open the token up. The rest of this entry does that, from the smallest piece to the whole.
Where the time goes, part by part
This is the breakout I use on the RTX 5090 (VRAM): every part of one token, how often it runs, the shortest it could take, and what it really takes. Now for the M3 GPU (unified memory) too.
The M3 GPU (unified memory). llama.cpp ships a tool that times a single operation on the GPU, test-backend-ops (llama.cpp source, test-backend-ops). I exported the operations of a real Qwen3 8B token from llama.cpp itself and timed each one on the M3, twice, after the chip had cooled, at the exact build the M3 GPU (unified memory) runs. Then I multiplied by how often each runs in one token.
| Apple M3, llama.cpp: part of the token | Weight shape, format | Runs per token | Floor | Measured | Above floor | Reads at |
|---|---|---|---|---|---|---|
| Feed-forward gate and up | 12288 x 4096, 4-bit | 72 | 22.67 ms | 26.17 ms | +3.49 ms | 78 GB per second |
| Feed-forward down | 4096 x 12288, 6-bit | 18 | 8.27 ms | 9.25 ms | +0.98 ms | 80 GB per second |
| Attention query and output | 4096 x 4096, 4-bit | 72 | 7.56 ms | 8.39 ms | +0.83 ms | 81 GB per second |
| Feed-forward down | 4096 x 12288, 4-bit | 18 | 5.67 ms | 6.28 ms | +0.61 ms | 81 GB per second |
| Vocabulary projection | 151936 x 4096, 6-bit | 1 | 5.68 ms | 6.00 ms | +0.33 ms | 85 GB per second |
| Attention key and value | 1024 x 4096, 4-bit | 54 | 1.42 ms | 1.37 ms | -0.05 ms | 93 GB per second |
| Attention value | 1024 x 4096, 6-bit | 18 | 0.69 ms | 0.63 ms | -0.06 ms | 99 GB per second |
| All the weight tables | 253 | 51.95 ms | 58.08 ms | +6.13 ms | ||
| Attention itself, 512 tokens loaded | 32 heads x 128 | 36 | 1.17 ms | |||
| Norms, rotation, adds, cache writes | small | 544 | 1.83 ms |
Two things stand out.
The big tables read at 78 to 85 GB per second against a memory that moves 89.9. That is the whole gap on the M3 GPU (unified memory), and gate and up is more than half of it: 3.5 of the 6.1 milliseconds. The two small tables look faster than the memory. They are small enough, 2.4 and 3.4 MB, to stay in the chip's cache when a benchmark repeats them, so those two rows flatter the kernel. The big tables cannot, and they tell the truth.
And the parts add up to more than the token. Timed one by one they come to 61.1 ms. The real token with 512 tokens loaded takes 58.8. llama.cpp on Metal runs neighbouring operations at the same time and folds small ones together, so in the real token the norms, the adds and most of the attention hide behind the weight reading. On the M3 GPU (unified memory), the time between kernels costs nothing. It is negative.
Both chips, side by side. The numbers for the RTX 5090 (VRAM) are llama.cpp's own kernels, measured on NVIDIA's profiling interface in my records, with 512 tokens loaded (fork records, active-body ledger, fork records, lifecycle ledger). The M3 GPU (unified memory)'s are the table above.
| One token, 512 tokens loaded | Apple M3, llama.cpp | NVIDIA RTX 5090, llama.cpp |
|---|---|---|
| Reading the weights at the floor | 51,953 microseconds, 88% | 2,747 microseconds, 68% |
| The weight kernels, above their floor | +6,125, 10% | +548, 14% |
| Everything else: attention, norms, small kernels | +3,007, 5% | +583, 15% |
| Between kernels | -2,262, hidden by overlap | +144, 4% |
| The real token | 58,824 | 4,022 |
There is the why. On the RTX 5090 (VRAM), a third of the token is something other than reading weights at full speed: 14% in weight kernels that run slower than the floor, 15% in other kernels, 4% in the gaps. On the M3 GPU (unified memory) it is 12%, and a third of that hides behind the reading. Three reasons, all visible in the rows:
- Small kernels do not get 18.9 times faster. The memory is 18.9 times faster on the RTX 5090 (VRAM). A norm or an add is not. On the M3 GPU (unified memory) the 544 small operations average 3.4 microseconds each. On the RTX 5090 (VRAM) the same kind of work, norms, attention and the rest, still costs 583 microseconds per token. A few hundred microseconds is nothing in a 58 millisecond token. It is 15% of a 4 millisecond one.
- Small tables cannot fill a fast memory. On the RTX 5090 (VRAM) llama.cpp reads gate and up at 93% of the memory rate and the vocabulary at 99.6%. But query, key and value together only reach 58%, and the attention output 70%. Those tables are 2 to 9 MB. At 1,700 GB per second the floor to read one is 1.4 to 5.5 microseconds, too short for a kernel to spin up enough reads in flight before it is already winding down. Little's law says how much must be in flight to keep a memory busy: its speed times its wait (Little, 1961). The faster the memory, the more a kernel must have in flight, and a small table does not have enough to give. On the M3 GPU (unified memory) the same tables take 25 to 117 microseconds, plenty of time.
- The gaps between kernels. 144 microseconds per token on the RTX 5090 (VRAM), 4%. On the M3 GPU (unified memory) they are hidden completely.
So the improvements are in different places on the two chips. On the M3 GPU (unified memory): the big weight kernels, gate and up first, from 78 GB per second toward 90. On the RTX 5090 (VRAM): the small tables, the small kernels and the gaps, which is exactly where my records found the time going on the RTX 5090 (VRAM) too (fork records, lifecycle ledger).
How the breakouts tie out: Little and Volkov
An audit is not done when the rows look plausible. It is done when every microsecond of the total is accounted for. My method notes write a token's time as one equation (fork records, what makes inference fast):
For writing a token the bytes win, drops out, and the token splits into three measured parts:
The notes add one warning: the gaps "must be measured", because a GPU can overlap work and make some of them disappear (fork records, what makes inference fast). Here is each chip, tied out to the microsecond.
| Apple M3, llama.cpp, 512 tokens loaded | Microseconds | Share of the real token |
|---|---|---|
| The floor: every weight read once at 89.9 GB per second | 51,953 | 88.3% |
| Weight kernels, reading slower than the floor | +6,125 | 10.4% |
| Other kernels: attention, norms, small operations | +3,007 | 5.1% |
| Every kernel, each timed on its own, added up | 61,085 | |
| The real token, timed by llama-bench | 58,824 | |
| The difference: the gaps between kernels, net of overlap | -2,262 | -3.8% |
| NVIDIA RTX 5090, llama.cpp, 512 tokens loaded | Microseconds | Share of the real token |
|---|---|---|
| The floor: every weight read once at 1,700 GB per second | 2,747 | 68.3% |
| Weight kernels, reading slower than the floor | +548 | 13.6% |
| Other kernels: attention, norms, small operations | +583 | 14.5% |
| Every kernel, measured on NVIDIA's profiling interface, added up | 3,878 | |
| The real token, timed end to end | 4,022 | |
| The difference: the gaps between kernels | +144 | 3.6% |
The last row of each table is not a plug. It is the difference between two separate measurements: every kernel added up, and the real token timed on its own. So it is the test. It has to be small, and it has to make sense. On the RTX 5090 (VRAM) it is +144 microseconds, 3.6% of the token: the gaps. On the M3 GPU (unified memory) it is negative, and that makes sense too: in the real token llama.cpp runs neighbouring kernels at the same time, which timing them one at a time cannot see. Both tie out.
That is the easy part. The interesting part is why the kernels lose, and the two papers in this entry's sources explain it, one per chip.
Little's law (Little, 1961): the amount of work in flight equals the rate times the wait. For a memory it reads like this:
is what is in flight, the rate, the wait.
For every microsecond a read waits, the RTX 5090 (VRAM) must have 1.7 MB in flight to stay busy. The M3 GPU (unified memory) needs 90 KB. The same kernel design has to keep a pipe 19 times fuller on the RTX 5090 (VRAM).
Volkov showed what that costs a GPU kernel: enough independent work must be in flight to cover the wait, and more threads is only one way to get it (Volkov, 2016). My notes put it in one line: "required concurrency ~= latency * throughput" (fork records, what makes inference fast), which is Little's law again:
A kernel that cannot supply that much loses in one of two ways, and the two chips show one each.
| llama.cpp, one call of each weight kernel | Size | Floor | Measured | Over the floor |
|---|---|---|---|---|
| NVIDIA RTX 5090: gate and up | 28.3 MB | 16.65 microseconds | 17.93 | +1.28, 7% |
| NVIDIA RTX 5090: attention output | 9.4 MB | 5.55 | 7.92 | +2.37, 30% |
| NVIDIA RTX 5090: vocabulary | 510.5 MB | 300.30 | 301.60 | +1.30, 0.4% |
| Apple M3: attention query and output | 9.4 MB | 105.0 | 116.5 | +11.5, 10% |
| Apple M3: gate and up | 28.3 MB | 314.9 | 363.4 | +48.5, 13% |
| Apple M3: vocabulary | 510.5 MB | 5,678.6 | 6,003.8 | +325.2, 5% |
Read down the last column.
On the RTX 5090 (VRAM) the loss is a fixed toll per kernel. Gate and up and the vocabulary are 18 times apart in size and lose the same 1.3 microseconds each. That is the start and the end of a kernel: the first reads wait with nothing yet in flight to hide them, and the last ones drain with nothing left to overlap. Volkov's latency, paid once per launch. For a 510 MB table it is nothing. For a 9 MB table, whose whole floor is 5.6 microseconds, it is 30%. 253 weight kernels a token, at about 2 microseconds each on average, is the 548 in the first table (fork records, active-body ledger).
On the M3 GPU (unified memory) the loss is a steady rate. The excess grows with the table, 10%, 13%, 5%, all the way through the call. The toll at the edges is still there, but a few microseconds vanish inside a 363 microsecond kernel. What shows instead is that the kernels hold a little less in flight than Little's law asks for, the whole time: they read at 78 to 85 GB per second, not 89.9.
That is how the two tables in this entry reconcile with the two papers in its sources:
- The floor is the roofline: bytes over speed.
- The kernel rows are Little and Volkov: not enough in flight. On a fast memory it shows up as a toll per launch, because the pipe is huge and small tables end before it fills. On a slow memory it shows up as a rate, because the pipe is small and the kernel spends its whole life in steady state.
- The gap row is the token's lifecycle, and my notes are right that it must be measured, not assumed. On the M3 GPU (unified memory) it came out negative.
And it says where to push on each. On the RTX 5090 (VRAM), fewer and larger kernels, so the toll is paid less often: that is fusion, and it is exactly what my records chased on the RTX 5090 (VRAM). On the M3 GPU (unified memory), more reads in flight inside each big kernel: that is the Volkov layer, more independent accumulators, more rows per thread group, deeper prefetch (fork records, what makes inference fast).
The tensor, the kernel, the token
A tensor is one table of numbers in the model. The gate table of one layer is a tensor: 12,288 rows by 4,096 columns, 4-bit. The model is 36 layers times a handful of tensors, plus the vocabulary. BoltBeam's first job is to list them by role, shape and format, because everything after depends on those three facts.
A kernel is one small program that does one step of the sums on the chip. Multiply this tensor by this vector. Normalize this row. Add these two. It is written once, compiled for the chip, and launched hundreds of times per token. A kernel has a geometry: how many threads it launches, how they are grouped, how big a tile of the table each group owns, and how many table rows it walks before it writes an answer. Change the geometry and the same sums run at a different speed.
A token is a sequence of kernel launches. My census of one token on the RTX 5090 (VRAM), before the second half of the summer's work, counted where the microseconds went (fork records, kernel census):
| NVIDIA RTX 5090, tinygrad, 3 August, 512 tokens loaded: part of the token | Weight shape, format | Launches per token | Microseconds | Share |
|---|---|---|---|---|
| Feed-forward gate and up | 12288 x 4096, 4-bit | 36 | 1,419 | 23.7% |
| Attention query and output | 4096 x 4096, 4-bit | 72 | 680 | 11.4% |
| Feed-forward down | 4096 x 12288, 6-bit | 18 | 635 | 10.6% |
| Attention key and value | 1024 x 4096, 4-bit and 6-bit | 72 | 587 | 9.8% |
| Feed-forward down | 4096 x 12288, 4-bit | 18 | 486 | 8.1% |
| The attention step itself | 32 heads x 128 | 72 | 365 | 6.1% |
| Vocabulary projection | 151936 x 4096, 6-bit | 1 | 329 | 5.5% |
| Normalization | 73 | 283 | 4.7% | |
| Small elementwise work | 24 different kernels | 586 | 1,196 | 20.0% |
Read the last two rows. A fifth of the token was 586 launches of small kernels that read almost nothing. They are not on the roofline at all. The roofline is about bytes and sums, and those kernels are about launches. That row is where a program can lose to another program that reads exactly the same bytes.
The lifecycle of a kernel, in my fork, is strict (fork records, pure machine search). It is generated from a description, never typed by hand. It is selected by a search. It is verified by the compiler's gates: the output must match the reference token for token. It carries a label saying where it came from, and only two labels may ship: generated by the search, or generated by tinygrad's own scheduler. A hand-written kernel may stay as a rollback or as a ceiling to compare against. It may not be the default.
The lifecycle of a token is the order those kernels run in, and what happens between them. Between two kernels the chip can sit idle: the first one finishes, the driver notices, the second one starts. On the M3 GPU (unified memory) that gap is noise against a 57 millisecond token. On the RTX 5090 (VRAM) it is the third of the token that is missing.
The search space
The geometry of a kernel is not derived. It is searched. The question is what to search over, and who decides.
tinygrad ships its own search, called BEAM. It has one fixed list of changes, the same for every chip. It tries them on one kernel at a time, times each candidate three times on the GPU, and keeps the fastest (tinygrad source, search.py). It works. It also returns a winner and a number and no reason, and it times one kernel alone, which is exactly the test that shipped whole-token slowdowns for me.
So I do not use BEAM. I use three tools of my own in its place, one for each step BEAM does:
| The step, on any GPU | tinygrad's BEAM | What I use instead, with tinygrad |
|---|---|---|
| What to try | One fixed list of changes, the same for every chip | BubbleBeam: works out the legal values from the facts the chip declares. Runs on the main processor, never touches the GPU. |
| What to skip | Nothing. Every candidate that compiles gets timed on the GPU | FutureSight: rejects the candidates that cannot fit or cannot cover their threads, and orders the rest, before anything runs. Still no GPU. |
| How to judge | The fastest of 3 runs, for one kernel alone | BoltBeam: spends GPU time only on what survived, judges the whole token, gives one of eight verdicts. It asks the chip for its own facts first, so one worker serves the RTX 5090 (VRAM) and the M3 GPU (unified memory), and nothing is typed in per vendor (BoltBeam records, exp 26c62e6; fork, live flash). |
| What is kept | The winning settings, in a cache. No reason | BoltBeam: a ledger entry with the reason, for wins and losses alike. |
GPU time is the expensive part, so the two cheap tools run first and the expensive one runs last. The names are a pun on BEAM. That is all the names are.
What makes the search space mine is that it is built from facts, not from a list. BoltBeam's registry says what is legal:
- Shapes. The role decides the shape, and the shape decides the family. A 12,288 by 4,096 4-bit table with one input vector is a GEMV, a matrix times a vector, and it gets the
lanemap_gemvfamily. The vocabulary table, 151,936 rows, gets its own family because its rows are so many and its columns so few. - Formats.
Q4_Kpacks 256 weights into 144 bytes;Q6_Kpacks 256 into 210. Each format has its own list of legal routes and its own list of refuted ones.Q6_Kalready carries one refutation, a half-warp direct route that lost (BoltBeam quant registry). - The chip's facts. How wide a thread group is. Whether there is a matrix unit and what shape it takes. How wide a memory load can be, 128 bits on both chips. Fast local memory, and how much. A route that needs a fact the chip does not declare is not legal on that chip.
47 candidate routes are in the registry today, in eleven families; 5 are promoted, 7 refuted (BoltBeam candidate registry). The refuted ones stay, so nobody pays for them twice.
Hiding, fusing, and keeping the sums busy
Three ideas run through every fast kernel. The spec sheet tells you which one you are short of.
Hiding. Memory is slow next to sums, on every chip. A GPU covers that by keeping many threads in flight: while one waits for its bytes, others work. How many must be in flight is Little's law (Little, 1961): work in flight equals latency times throughput. Volkov's dissertation is about exactly this trade on GPUs, and it found that earlier performance models "mispredict observed throughputs by factors of up to 1.7" (Volkov, 2016). That is why nothing here is quoted; it is measured.
The cleanest example I own is on GitHub. On 31 July the RTX 5090 (VRAM) made 4.49 tokens per second, moving 1.3% of what its memory can. My compiler had never been told the chip's threads run in groups of 32, so the search space was wrong and every 4-bit multiply went down a slow generic path. One declared fact later: 156.2 tokens per second, 44% of the memory (fork records, new target bring-up). Nothing about the kernel changed. A fact about the chip did, and the search did the rest. The M3 GPU (unified memory) has the same fact, 32, under a different name.
Fusing. Two kernels that run one after the other can be one kernel, and the boundary between them, a launch, a write, a read back, disappears. That is the cure for the 586 small launches in the table above. It is also where the math must come first. The bound for fusing all the small elementwise kernels together was 2.8 tokens per second at most; the run returned 0.2, and the idea was closed the same day (BoltBeam records, 14B aggregate fusion closeout). Fusion can also go the wrong way: merging two attention kernels once dropped decode by 88%, because the boundary had been the parallelism, and the merged kernel ran too few threads to hide its own latency (fork records, what makes inference fast). Hiding and fusing pull against each other. The ledger holds the line.
Keeping the sums busy. Writing a token is a memory problem, so the sums are idle most of the time and that is fine. Reading the prompt is the opposite: 512 tokens use each weight 512 times, about 1,800 sums per byte, far above both chips' 150 and 35. There the matrix unit decides, and the spec sheet's 61% is the whole story: the RTX 5090's tensor cores measured at 255.4 trillion sums per second against 419 on the sheet (fork records, new target bring-up). Prefill is the next entry. It has a different top line, and different kernels.
Dtypes. The format a number is stored in, the format it is computed in, and the format the answer is kept in are three different choices. The weights are 4-bit and 6-bit. The activations move as 16-bit floats. Sums accumulate in 32 bits so nothing rounds away. And one refuted route on the ledger says why the order matters: never unpack an integer weight format through 16-bit floats. The GPU converts through 32 bits first, the conversions double, and the kernel runs 16% slower (BoltBeam candidate registry, decode_q4k_gemv_f16_dequant). Keep the weights packed to the last moment. Unpack in registers. Never write the unpacked copy anywhere.
That is the whole toolkit: hide the latency, fuse the boundaries, feed the matrix unit when the work is sums, keep the bytes packed when the work is memory, and let a search pick the geometry from the chip's declared facts. Every one of those is measured against the same two numbers from the top of this entry.
How this made tinygrad faster on NVIDIA
Everything above is not a theory I tested once. It is the process I used all summer to make tinygrad fast on the RTX 5090 (VRAM), and the reason is simple. I did not want to hand-write kernels. A hand-written kernel is a recipe for one chip, written by one person, and it rots the day the chip changes. I wanted tinygrad to emit its kernels: generate them from a description, let BubbleBeam, FutureSight and BoltBeam pick the geometry, and let the compiler's gates prove them correct. The rule in my fork is strict about it. The kernel that runs by default must be generated by the search or by tinygrad's own scheduler. A hand-written one may stay as a rollback or a yardstick, never as the default (fork records, pure machine search).
No CUDA. On NVIDIA, tinygrad's production path is its NV device, and it does not go through CUDA to run anything. It still uses NVIDIA's compiler to turn a kernel into machine code, a cubin. Then it talks to the GPU driver itself and writes the launches straight into the GPU's command queues (tinygrad source, ops_nv.py). No CUDA runtime in the loop, nothing between my kernel and the chip that I cannot read.
That has a price, and it is a funny one. NVIDIA's own profiler cannot see it. Nsight Compute, pointed at the production path, reported "No kernels were profiled" (fork records, third-party theory audit). The tool that reads the chip's counters only listens to CUDA, and I was not speaking CUDA.
So Nsight for the counters. To read the counters anyway, I took the exact kernels tinygrad had installed, the same compiled bytes, and launched them through CUDA under NVIDIA's profiling interface, CUPTI, with llama.cpp's own released kernels measured the same way. One protocol for both programs. That is how the ledger found out where the time really went (fork records, active-body ledger).
The whole climb, from the records:
| Date | tinygrad on the NVIDIA RTX 5090 | llama.cpp on the NVIDIA RTX 5090 | What changed |
|---|---|---|---|
| 31 July | 4.49 tokens per second, 1.3% of the memory | First day. Every 4-bit multiply on a slow generic path (fork records, new target bring-up) | |
| 31 July | 156.2, 44% of the memory | One declared fact: threads move in groups of 32 (fork records, new target bring-up) | |
| 27 August | 246.27 | 248.71 | 38.8 microseconds per token behind (fork records, lifecycle ledger) |
| 1 September | 247.80 | 246.41 | 0.56% ahead, 22.8 microseconds per token, strict protocol (fork records, decode ledger) |
With 512 tokens of conversation loaded, on the same RTX 5090, with kernels nobody typed by hand.
And the counters said something I did not expect. Kernel for kernel, tinygrad's bodies were already faster than llama.cpp's in aggregate: the gate and up projections, the down projection, query, key and value, the normalization and the attention score all won, by 169.9 microseconds per token together (fork records, decode ledger). Only two lost, the vocabulary step by 8.4 and the attention output by 3.0. So why was the whole token only 22.8 ahead, and on 27 August behind? Because the loss was never in the kernels. It was between them: launching them, and the moments the GPU sat idle between one and the next (fork records, lifecycle ledger). That is the third of every token from the table at the top of this entry, found with counters, charged to a line.
What it cannot tell you
- Decode only. Prefill has a different top line, and its kernels are the next entry.
- One model, two chips, one short session each. That is why this entry is marked seen once.
- The runs are short: 64 tokens on the M3 GPU (unified memory), 128 on the RTX 5090 (VRAM), 20 for tinygrad. The M3 GPU (unified memory) sits in a MacBook Air with no fan; a long run would heat it and slow it, and I did not test that.
- The breakout on the M3 GPU (unified memory) times each operation alone and repeats it. That flatters the two small tables, which stay in cache, and it cannot see the overlap in the real token, which is why the parts add up to more than the whole. The breakout on the RTX 5090 (VRAM) was measured a different way, on NVIDIA's profiling interface. Read the side-by-side table for its shape, not to the microsecond.
- The memory speed of the M3 GPU (unified memory) is one method, a large copy inside the chip, read and write counted as equal traffic. Its sums per second are one benchmark's plateau, not a vendor figure; Apple publishes none. The numbers for the RTX 5090 (VRAM) come from proper tests in my records (fork records, new target bring-up).
- The limit counts the weights. It leaves out the memory of the conversation so far, about 3% here. In a long conversation that part grows.
- The census table is one run on the RTX 5090 (VRAM), from early August; the ledger has moved since. It is here for its shape, not as the current standing.
- I did not run a whole token with tinygrad on the M3 GPU (unified memory), only three attention tiles, and the tinygrad run on the RTX 5090 (VRAM) is a single short one.
- One kind of model. Some newer models do not read all of themselves for every token, and the division needs a different top line for those.
How I ran it
The model is Qwen3 8B in 4-bit, 5,021,827,072 bytes, the same file family on both machines.
- I gave BoltBeam a line of facts about the M3 GPU (unified memory), with Apple's 100 GB per second.
boltbeam inspect MODEL.gguflisted the parts of the model. It does not use the chip at all.- I measured the speed of the M3 GPU's unified memory with tinygrad: a 2 GiB copy inside the chip, best of five. 45.0 GB copied per second, which is 89.9 GB of memory traffic per second. Sums per second: the fork's
wmma_peak_metal.pystages 1 to 3 (grid sweep, accumulator sweep, grid re-sweep at the winner) plateau at 3,152 billion, accumulators 2, spread under 1%;fma_peak_metal.pyat the M4's winning settings gives 3,241 (fp16 into fp16), 2,886 (fp16 into fp32) and 2,819 (fp32). Its fourth stage, a disassembly check, needs Apple's command-line Metal compiler, which this MacBook Air lacks, so it was not run. An earlier untuned tinygrad fp16 multiply had given 3.18, between the matrix unit and fp16-into-fp16 arithmetic. boltbeam roofline-theoretical MODEL.gguf --context 1gave the limit for each part of the model.llama-bench -p 0 -n 64 -r 3 -ngl 99on the M3 GPU (unified memory) gave 17.51, 17.57 and 17.62. A second session with-d 0,512gave 18.30, 17.88, 16.19 at none, and 17.02, 16.87, 17.10 with 512 tokens loaded; the first set shows the M3 GPU (unified memory) warming up in a fanless MacBook Air. With-n 128on the RTX 5090 (VRAM) it gave 248.8, 253.9 and 255.1. With-d 512it gave 243.8, 249.2 and 250.4.- For the breakout, llama.cpp's own tools at the build I ran on the M3 GPU, 48d22e295:
test-export-graph-ops -m MODEL.gguf -c 1024 -ub 512 -fa onexported the token's operations, andtest-backend-ops perf --test-filetimed the 21 single-token ones on the M3, twice, after a cooldown. Attention was timed again with 64 and 512 tokens loaded: 18.5 and 32.6 microseconds per layer. - My tinygrad version ran its own fixed-context timing script on the RTX 5090 (VRAM): 512 tokens loaded first, then 20 tokens timed, once. 4.20 milliseconds per token. The run took 312 seconds in all, nearly all of it loading.
The RTX 5090's facts and history are in the public fork: the bring-up record (fork records, new target bring-up), the decode ledger (fork records, decode ledger), the kernel census (fork records, kernel census) and the method notes (fork records, what makes inference fast). The full record of this entry, with every command and number, is in my research repository (my records, M3 roofline check, 21 September 2026).
Author's note: where this stands
I stopped working on inference in early September to focus on GameTerm. The last kernel commit on my inference branch is from 7 September. On 22 September the tooling moved: BubbleBeam and FutureSight moved into BoltBeam, and the search worker learned to ask the chip for its facts. No kernel changed. So this is a snapshot, not a finish line.
Where it stands, honestly:
- Decode on the RTX 5090. My tinygrad was 0.56% ahead of llama.cpp on 1 September under the strict protocol (fork records, decode ledger). The quick run in this entry, three weeks later, had it 4.2% behind. Both are true; they are different protocols, and the careful one is the authority.
- What is still open there. Two kernels still lose, the vocabulary step and the attention output. Past the kernels, the remaining loss is launch and idle time between kernels, not the sums themselves (fork records, lifecycle ledger).
- Prefill. Unfinished. Reading the prompt is limited by the matrix unit, not memory, and that work was mid-flight when I stopped. It is the next entry.
- Apple. For a whole token, the M3 GPU (unified memory) in this entry only ran llama.cpp. On 22 September BoltBeam drove my tinygrad on this M3 for the first time: it built, checked and timed three flash attention tiles, cold, at 53 to 80 microseconds for 513 tokens of context. The same tiles on the RTX 5090 the same day: 7.5 to 16.4 (fork, live flash). A whole token with my tinygrad on the M3 is still not measured. My tinygrad has run on an Apple M4 before, where decode worked and prefill was well behind llama.cpp.
- The tools. BoltBeam, BubbleBeam and FutureSight keep working without me: their registries, ledgers and tests are current. The 22 September run also caught a bad flush. tinygrad's cold-cache call on NVIDIA writes the cache back and evicts nothing: a 64 MiB read still ran at 2.03 TB per second after it, above the rate of the RTX 5090's VRAM, so it was still in the 96 MiB cache. A store kernel over 256 MiB fixes it (fork, NV flush). Apple has no flush call at all, so the M3 GPU (unified memory) got the same kind of scrub (fork, Metal flush). Every cold-cache number tinygrad produced through that call on NVIDIA before that day was warm.
When I come back, I start where the ledger says the time is.
Formulas used here
Every number in this entry comes from one of these. Each is shown once, with a worked example from the entry itself, so you can check it with a calculator. None of them runs a program: they are arithmetic on the chips' facts and the model file.
| Symbol, no program | Means |
|---|---|
bits per weight, 4.5 for Q4_K and 6.5625 for Q6_K | |
| bytes one token reads, 4.68 GB for this model | |
| memory speed, measured: 1,700 GB per second on the NVIDIA RTX 5090, 89.9 on the Apple M3 | |
| sums per second, measured: 255.4 trillion on the NVIDIA RTX 5090, 3.15 trillion on the Apple M3 | |
| tokens processed together: 1 when writing, 512 for a prompt | |
| weights in the model | |
| sums one token needs, about 2 for every weight | |
| a time, with what it is for written under it | |
| , , | Little's law: what is in flight, the rate, the wait |
The model
| # | Formula, no program | Worked example |
|---|---|---|
| 1 | Q4_K: . Q6_K: | |
| 2 | Gate table: MB. Vocabulary: 510.5 MB | |
| 3 | , where is how often table runs per token | Every table of Qwen3 8B, from boltbeam inspect: 4.68 GB, the same on both GPUs |
| 4 | MB more per token |
The chip, and the limit
| # | Formula, no program | Worked example |
|---|---|---|
| 5 | , from | NVIDIA RTX 5090: 42 tokens. Apple M3: 10 |
| 6 | memory bound when | Writing a token, : memory bound on both GPUs |
| 7 | NVIDIA RTX 5090: . Apple M3: | |
| 8 | NVIDIA RTX 5090: 2.75 ms per token. Apple M3: 52.0 ms | |
| 9 | Vocabulary on the NVIDIA RTX 5090: microseconds. Apple M3: 5,679 |
Reading a run
| # | Formula, no program | Worked example |
|---|---|---|
| 10 | Apple M3, llama.cpp, 512 tokens loaded: | |
| 11 | Apple M3, llama.cpp: GB per second | |
| 12 | Gate and up, one call, NVIDIA RTX 5090, llama.cpp: microseconds | |
| 13 | Gate and up, one call, Apple M3, llama.cpp: GB per second |
Tying a token out
| # | Formula, no program | Worked example |
|---|---|---|
| 14 | From my method notes. For writing a token the first term wins | |
| 15 | NVIDIA RTX 5090, llama.cpp: microseconds. Apple M3, llama.cpp: | |
| 16 | , so | Per microsecond of wait: NVIDIA RTX 5090, 1.7 MB. Apple M3, 90 KB |
Words used here
| Word | What it means here |
|---|---|
| Token | One small piece of text, roughly three quarters of an English word. A model writes one token at a time. It is also the unit the customer is billed by. |
| Tokens per second | How fast the model writes. People read about 5 tokens per second, so 20 already feels fast. 250 is a full page in about three seconds. |
| Model | The file of numbers that is the AI. This one is 5 GB. |
| Inference | Running a trained model to get an answer out of it. Every chat reply, every code suggestion, every summary is inference. Training the model is the other half. |
| Decode | The half of inference where the model writes its answer, one token at a time. Limited by memory. This entry. |
| Prefill | The other half, where the model reads your prompt before answering. Limited by sums. The next entry. |
| Tensor | One table of numbers in the model. A model is a few hundred of them. |
| Weights | The numbers in those tables. To write one token the chip reads almost all of them. |
| Kernel | One small program that does one step of the sums on the chip. A token needs hundreds of launches. |
| Geometry | A kernel's settings: how many threads, how they are grouped, how big a piece of the table each group owns. Same sums, different speed. |
| Search space | Every geometry that is legal on this chip for this tensor. The search picks from it; the ledger remembers what lost. |
| Route | One way to run one part of the model: a kernel family plus a geometry. |
| Chip, GPU, graphics card | The part of the computer that runs the model. A GPU is a chip built to do many small sums at once. |
| Warp, simdgroup | A group of threads that move in lockstep. 32 on both chips here. NVIDIA says warp, Apple says simdgroup. |
| Matrix unit, tensor core | A part of the chip that does a small block of multiplies in one go. It matters when the work is sums, which is prefill. |
| VRAM | The memory a graphics card carries for itself. The RTX 5090 has 32 GB of it; the model sits there, next to the chip. |
| Unified memory | One memory the main processor and the GPU share. The M3 has 16 GB; the model sits in the same memory the rest of the computer uses. |
| Memory speed | How much the chip's memory can hand over each second, in GB per second. Its technical name is memory bandwidth. The number that matters most here. |
| GB | A gigabyte, a billion bytes. A two hour film is a few GB. |
| Speed limit, or ceiling | The fastest this chip could ever write with this model. Memory speed divided by what one token reads. No program can beat it. |
| Floor | The same idea as a time: the shortest a token, or one step of it, can take on this chip. |
| Roofline | The method. A program is held back either by sums or by memory, and the roofline tells you which, from two numbers about the chip (Williams, Waterman and Patterson, 2009). |
| Ridge point | Where the two limits meet: how many sums the chip can do per byte its memory delivers. 150 on the RTX 5090 (VRAM), about 35 on the M3 GPU (unified memory). Below it, memory bound; above it, sums bound. |
| Latency hiding | Keeping enough threads in flight that while one waits for memory, others work. Little's law says how many. |
| Fusion | Making two kernels into one, so the boundary between them disappears. Fewer launches, fewer trips to memory. Sometimes fewer threads too, which is the catch. |
| Dtype | The format a number is stored or computed in: 4-bit, 6-bit, 16-bit float, 32-bit float. Three different choices for weights, activations and sums. |
| Quantization, 4-bit, 6-bit | Storing each weight in fewer bits. Fewer bits, fewer bytes to read, faster token, a small loss of quality. Q4_K is 4.5 bits a weight once its scales are counted; Q6_K is 6.5625. |
| Context | The conversation so far, kept in memory while the model writes. "512 tokens of context" means about a page was already loaded. |
| llama.cpp | A popular free program for running AI models on your own computer. |
| tinygrad | Another free program that does the same job, small enough to read end to end. I work on my own version. |
| BEAM | tinygrad's own kernel search. Tries a fixed list of changes, times each, keeps the fastest. No reason attached. I do not use it. |
| BubbleBeam | My tool for the first step of a search: it lists every legal setting for a kernel from the facts the chip declares. No GPU needed. |
| FutureSight | My tool for the second step: it throws out the settings that cannot work and orders the rest, before anything runs. No GPU needed. |
| Emit | To generate a kernel from a description instead of writing it by hand. |
| CUDA | NVIDIA's usual software for running programs on its GPUs. tinygrad's NV path does not use it to run kernels. |
| Nsight Compute, CUPTI | NVIDIA's profiler and the interface it listens on. They read the chip's hardware counters, but only for work launched through CUDA. |
| Cubin | A kernel turned into NVIDIA machine code, ready to run. |
| BoltBeam | My tool for the last step. It does not run the model. It reads the model and the chip's facts, works out the limits, spends GPU time only on what survived, judges the whole token, and keeps the ledger of what was tried. |
| Seen once | The grade of this entry. Measured for real, in one short session, not yet repeated. |
| Microsecond, millisecond | A millionth and a thousandth of a second. |
Sources
- Williams, S., Waterman, A., and Patterson, D. (2009). Roofline: An Insightful Visual Performance Model for Multicore Architectures. Communications of the ACM, 52(4), 65 to 76. doi.org/10.1145/1498765.1498785
- Little, J. D. C. (1961). A Proof for the Queuing Formula: L = λW. Operations Research, 9(3), 383 to 387. doi.org/10.1287/opre.9.3.383
- Volkov, V. (2016). Understanding Latency Hiding on GPUs. PhD dissertation, University of California, Berkeley. Technical Report UCB/EECS-2016-143. www2.eecs.berkeley.edu/Pubs/TechRpts/2016/EECS-2016-143.pdf
- Apple. MacBook Air (13-inch, M3, 2024), technical specifications: "100GB/s memory bandwidth". support.apple.com/en-us/118551
- llama.cpp. ggml-common.h, the Q6_K block: "Effectively 6.5625 bits per weight". github.com/ggml-org/llama.cpp
- tinygrad. The kernel search, search.py. github.com/tinygrad/tinygrad
- tinygrad-arkey, my public version of tinygrad. New target bring-up, decode ledger, kernel census, what makes inference fast, pure machine search, lifecycle ledger, active-body ledger, third-party theory audit, ops_nv.py, the NV device.
- tinygrad-arkey, 22 September 2026: the live flash worker, the Metal flush, the NVIDIA flush.
- The article this entry checks: BoltBeam: Opening the Black Box of Kernel Engineering.